Cold Starts
Cold starts (or init times) are an incredibly addictive topic. In many cases they can be ignored as an optimization to perform when the time and data suggests action. In practice, the more traffic your function handles the less likely cold starts are an issue since they statistically disappear under the 99th percentile. However in rare cases, you may want to optimize for them. This guide can help you make decisions on how to go about it. It also descibes how AWS may be doing this for you already with Proactive Initialization.
Modest sized Rails applications generally boot within 3 to 5 seconds. This happens exactly once for the duration of the function's lifecycle which could last for 30 minutes or more and service a huge amount of traffic with no latency.
Monitoring with CloudWatch
You can not optimize what you do not measure. Thankfully, AWS Lambda logs initialization time of your function to CloudWatch logs which you can query using CloudWatch Insights.
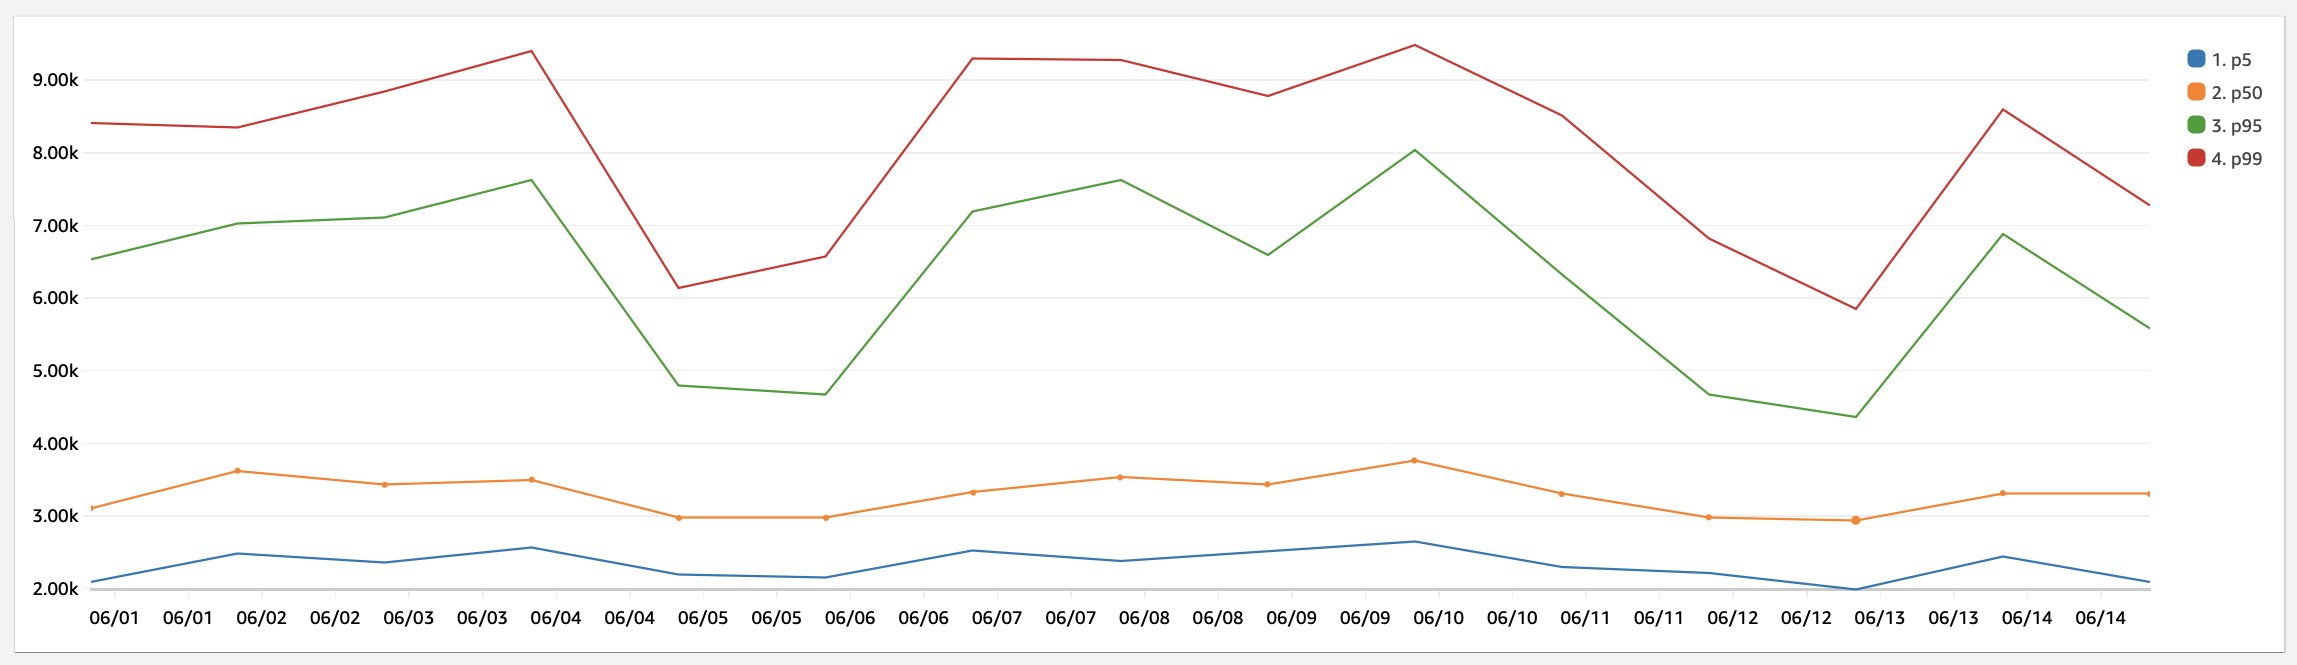
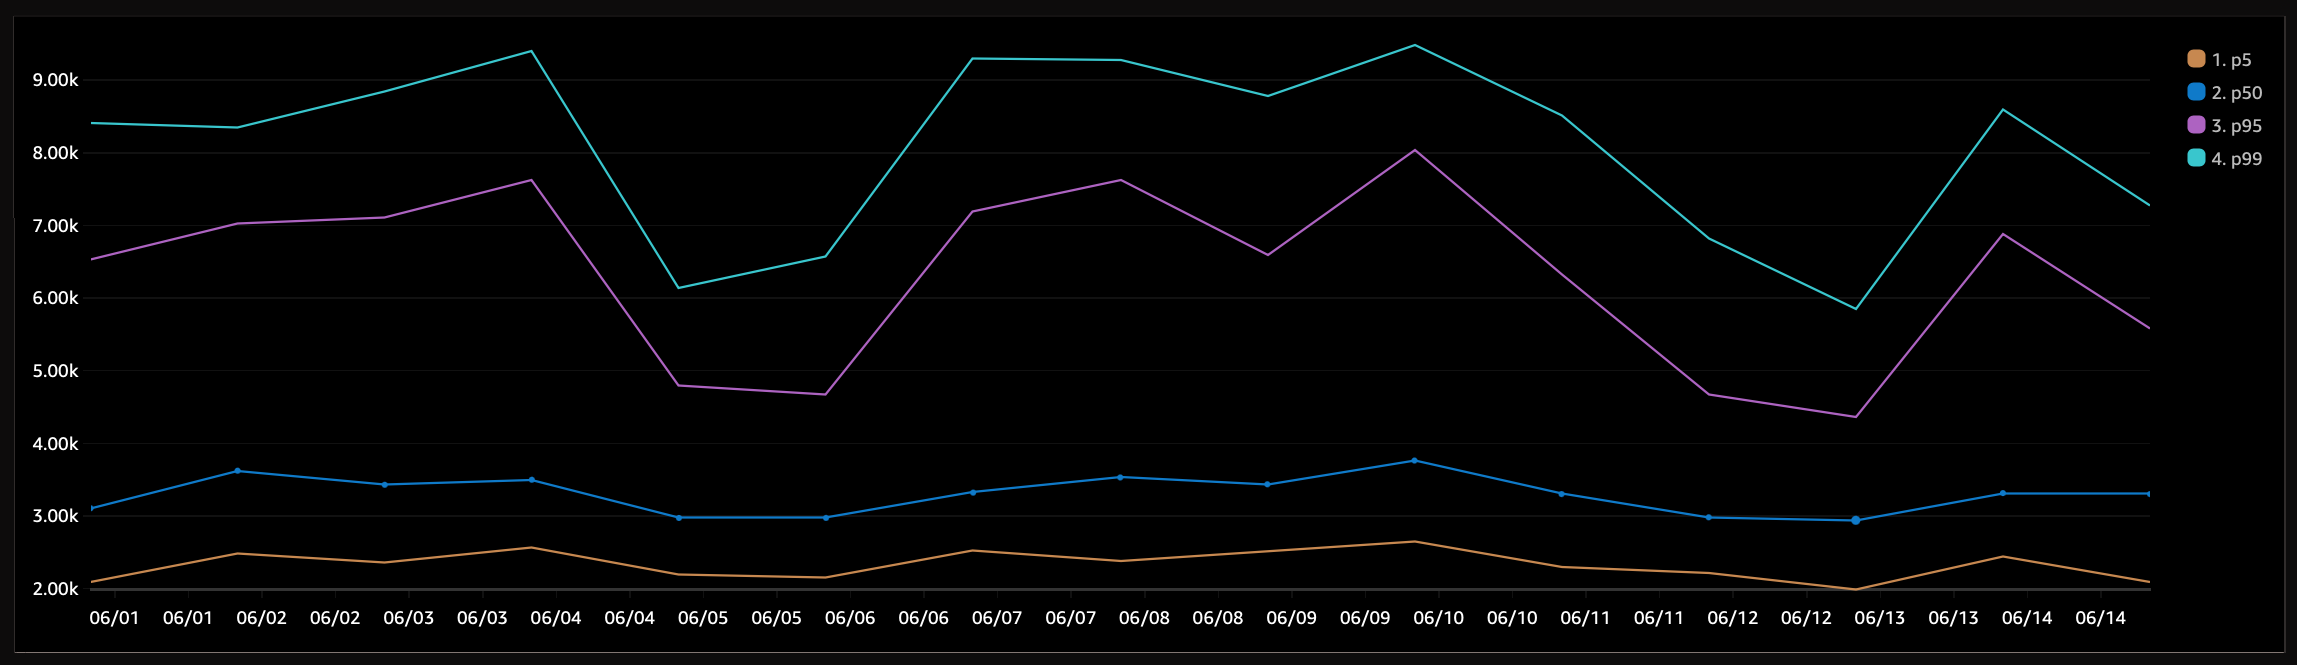
This query below will give you a nice percentile breakdown for your application's init duration which is the code outside the handler method. Feel free to change the bin bucket from 1 hour to whatever time helps you. For example, using 1d (1 day) over a longer duration (weeks) allows you to see statistical trends. In general, your p50 should be under 5 seconds.
fields @initDuration
| filter ispresent(@initDuration)
| stats pct(@initDuration, 5) as p5,
        pct(@initDuration, 50) as p50,
        pct(@initDuration, 95) as p95,
        pct(@initDuration, 99) as p99
  by bin(1h)
See the Proactive Initialization section for more details on how to use Lamby's new CloudWatch Metrics to measure both cold starts and proactive initialization.
Proactive Initialization
As described in AJ Stuyvenberg's post on the topic Understanding AWS Lambda Proactive Initialization, AWS Lambda may have solved some of your cold start issues for you since March 2023. Stated in an excerpt from AWS' docs:
For functions using unreserved (on-demand) concurrency, Lambda occasionally pre-initializes execution environments to reduce the number of cold start invocations. For example, Lambda might initialize a new execution environment to replace an execution environment that is about to be shut down. If a pre-initialized execution environment becomes available while Lambda is initializing a new execution environment to process an invocation, Lambda can use the pre-initialized execution environment.
This means the Monitoring with CloudWatch is just half the picture. But how much is your application potentially benefiting from proactive inits? Since Lamby v5.1.0, you can now find out easily using CloudWatch Metrics. To turn metrics on, enable the config like so:
config.lamby.cold_start_metrics = true
Lamby will now publish CloudWatch Embedded Metrics in the Lamby namespace with a custom dimension for each application's name. Captured metrics include counts for Cold Starts vs. Proactive Initializations. Here is an example running sum of 3 days of data for a large Rails application in the us-east-1 region.
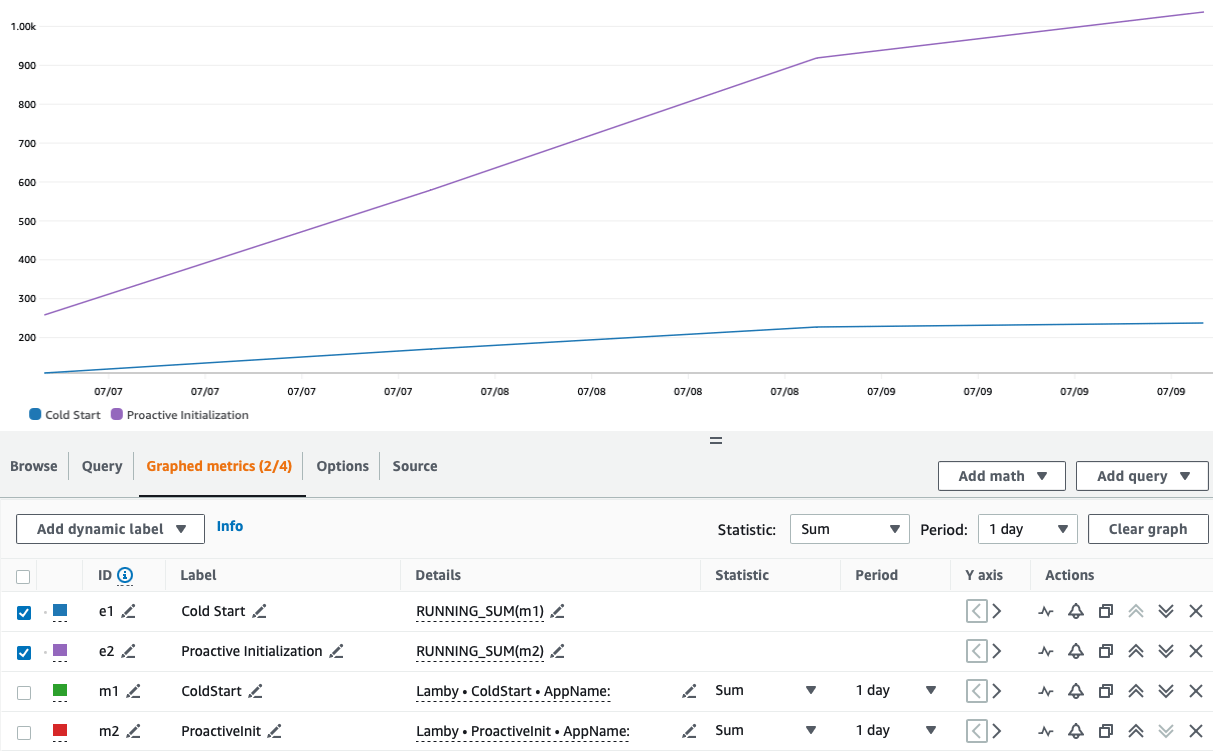
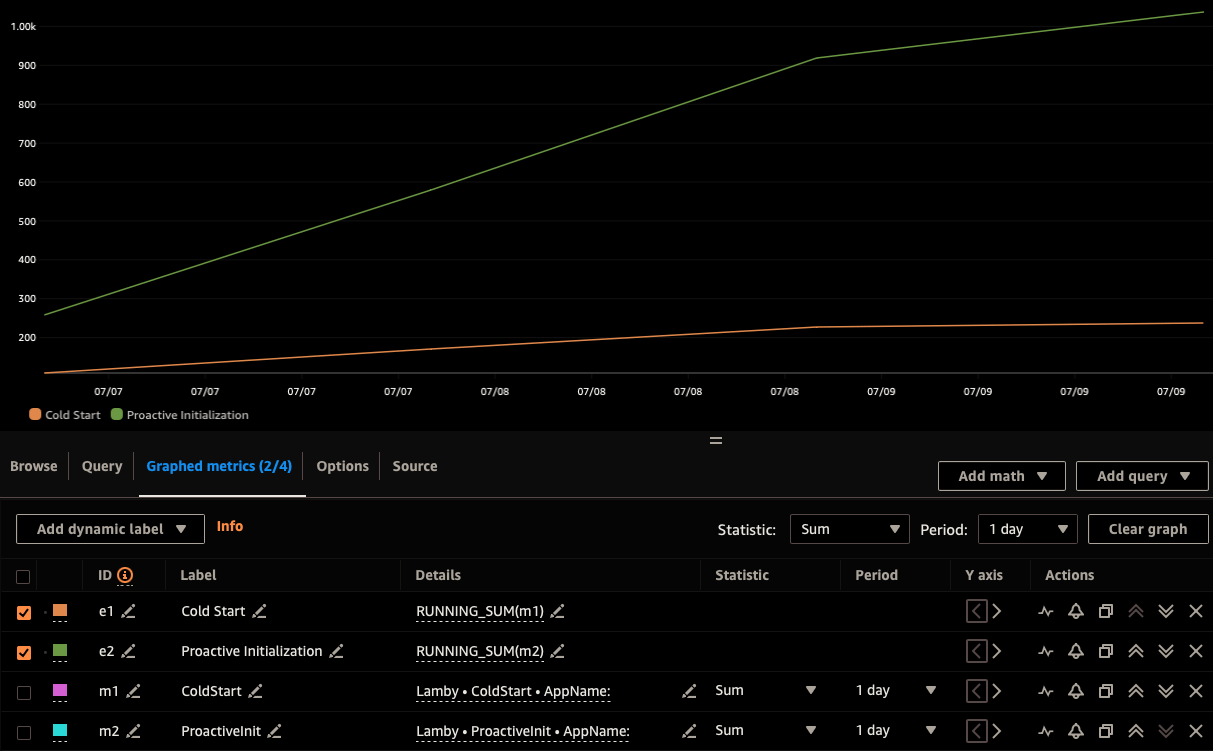
This data shows the vast majority of your initialized Lambda Containers are proactively initialized. Hence, no cold starts are felt by end users or consumers of your function. If you need to customize the name of your Rails application in the CloudWatch Metrics dimension, you can do so using this config.
config.lamby.metrics_app_name = 'MyServiceName'
Bootsnap by Shopify
Reducing your Rails applications boot time should be your first optimization option against true cold starts. Bootsnap has been developed by Shopify to speed up Rails boot time for production environments using a mix of compile and load path caches. When complete, your deployed container will have everything it needs to boot faster!
How much faster? Generally 1 to 3 seconds depending on your Lambda application. Adding Bootsnap to your Rails Lambda application is straightforward. First, add the gem to your production group in your Gemfile.
group :production do
  gem 'bootsnap'
end
Next, we need to add the Bootsnap caches with your deployed container. Add these lines to your project's Dockerfile after your COPY . . declaration. It will run two commands. The first is the standard Bootsnap precompile which builds both the Ruby ISeq & YAML caches. The second line loads your application into memory and thus automatically creates the $LOAD_PATH cache.
ENV BOOTSNAP_CACHE_DIR=/var/task/tmp/cache
RUN bundle exec bootsnap precompile --gemfile . \
 && bundle exec ruby config/environment.rb
Afterward you should be able to verify that Bootsnap's caches are working. Measure your cold starts using a 1 day stats duration for better long term visibility.
Other Cold Start Factors
Most of these should be considered before using Provisioned Concurrency. Also note, that Proactive Initialization may be masking some of these optimizations for you already. That said, consider the following:
Client Connect Timeouts - Your Lambda application may be used by clients who have a low http open timeout. If this is the case, you may have to increase client timeouts, leverage provisioned concurrency, and/or reduce initialization time.
Update Ruby - New versions of Ruby typically boot and run faster. Since our cookiecutter project uses custom Ruby Ubuntu with Lambda containers, updating Ruby should be as easy as changing a few lines of code.
Memory & vCPU - It has been proposed that increased Memory/vCPU could reduce cold starts. We have not seen any evidence of this. For example, we recommend that Rails functions use 1792 for its MemorySize equal to 1 vCPU. Any lower would sacrifice response times. Tests showed that increasing this to 3008 equal to 2 vCPUs did nothing for a basic Rails application but cost more. However, if your function does concurrent work doing initialization, consider testing different values here.
Lazy DB/Resource Connections - Rails is really good at lazy loading database connections. This is important to keep the "Init" phase of the Lambda execution lifecycle quick and under 10s. This allows the first "Invoke" to connect to other resources. To keep init duration low, make sure your application does not eagerly connect to resources. Both ActiveRecord and Memcached w/Dalli are lazy loaded by default.
ActiveRecord Schema Cache - Commonly called Rails' best kept performance feature, the schema cache can help reduce first request response time after Rails is initialized. So it should not help the init time but it could very easily help the first invoke times.
Reduce Image Size - Sort of related to your Ruby version, always make sure that your ECR image is as small as possible. Lambda Containers supports up to 10GB for your image. There is no data on how much this could effect cold starts. So please share your stories.
Provisioned Concurrency
Provisioned concurrency comes with additional execution costs. Now that we have Proactive Initialization it may never be needed.
AWS provides an option called Provisioned Concurrency (PC) which allows you to warm instances prior to receiving requests. This lets you execute Lambda functions with super low latency and no cold starts. Besides setting a static PC value, there are two fundamental methods for scaling with Provisioned Concurrency. Please use the Concurrency CloudWatch Metrics section to help you make a determination on what method is right for you.
Requirements
Our Quick Start cookiecutter includes both an AutoPublishAlias and an all at once DeploymentPreference. The publish alias is needed for provisioned concurrency. You can read about both in AWS "Deploying serverless applications gradually" guide. The code snippets below assume your function's logical resource is RailsLambda and you have an alias named live.
Auto Scaling
Here we are creating an AWS::AutoScaling::ScalingPolicy and a AWS::ApplicationAutoScaling::ScalableTarget which effectively creates a managed CloudWatch Rule that monitors your application to scale it up and down as needed. In this example we set a maximum of 40 and minimal of 5 provisioned instances. We have a TargetValue of 0.4 which is a percentage of provisioned concurrency to trigger the CloudWatch Rules via the ProvisionedConcurrencyUtilization metric. In this case, lower equals a more aggressive scaling strategy.
Resources:
  RailsLambda:
    # ...
    Properties:
      ProvisionedConcurrencyConfig:
        ProvisionedConcurrentExecutions: 5

  RailsScalableTarget:
    Type: AWS::ApplicationAutoScaling::ScalableTarget
    Properties:
      MaxCapacity: 40
      MinCapacity: 5
      ResourceId: !Sub function:${RailsLambda}:live
      RoleARN: !Sub arn:aws:iam::${AWS::AccountId}:role/aws-service-role/lambda.application-autoscaling.amazonaws.com/AWSServiceRoleForApplicationAutoScaling_LambdaConcurrency
      ScalableDimension: lambda:function:ProvisionedConcurrency
      ServiceNamespace: lambda
    DependsOn: RailsLambdaAliaslive

  RailsScalingPolicy:
    Type: AWS::ApplicationAutoScaling::ScalingPolicy
    Properties:
      PolicyName: utilization
      PolicyType: TargetTrackingScaling
      ScalingTargetId: !Ref RailsScalableTarget
      TargetTrackingScalingPolicyConfiguration:
        TargetValue: 0.4
        PredefinedMetricSpecification:
          PredefinedMetricType: LambdaProvisionedConcurrencyUtilization
Please read this related article. Lambda Provisioned Concurrency AutoScaling is Awesome. Make sure you understand how it works! It goes into great detail on how short traffic bursts (common for most of us) can be missed by the standard CloudWatch Alarms and possible remediation to scale up.
Using a Schedule
In this example we have measured via CloudWatch Metrics (image above) that our concurrent executions never really goes past 40 instances during daytime peak usage. In this case to totally remove cold starts from a small percentage of requests we can draw a big virtual box around the curves above to always keep 40 instances warm during our peak times starting at 6am EST and going back down to 0 Provisioned Concurrency at 11PM EST. Here is how we would do that with a Provisioned Concurrency schedule.
Resources:
  RailsScalableTarget:
    Type: AWS::ApplicationAutoScaling::ScalableTarget
    Properties:
      MaxCapacity: 0
      MinCapacity: 0
      ResourceId: !Sub function:${RailsLambda}:live
      RoleARN: !Sub arn:aws:iam::${AWS::AccountId}:role/aws-service-role/lambdaapplication-autoscaling. amazonaws.com/AWSServiceRoleForApplicationAutoScaling_LambdaConcurrency
      ScalableDimension: lambda:function:ProvisionedConcurrency
      ServiceNamespace: lambda
      ScheduledActions:
        - ScalableTargetAction:
            MaxCapacity: 0
            MinCapacity: 0
          ScheduledActionName: ScaleDown
          Schedule: "cron(0 3 * * ? *)"
        - ScalableTargetAction:
            MaxCapacity: 40
            MinCapacity: 40
          ScheduledActionName: ScaleUp
          Schedule: "cron(0 10 * * ? *)"
    DependsOn: RailsLambdaAliaslive
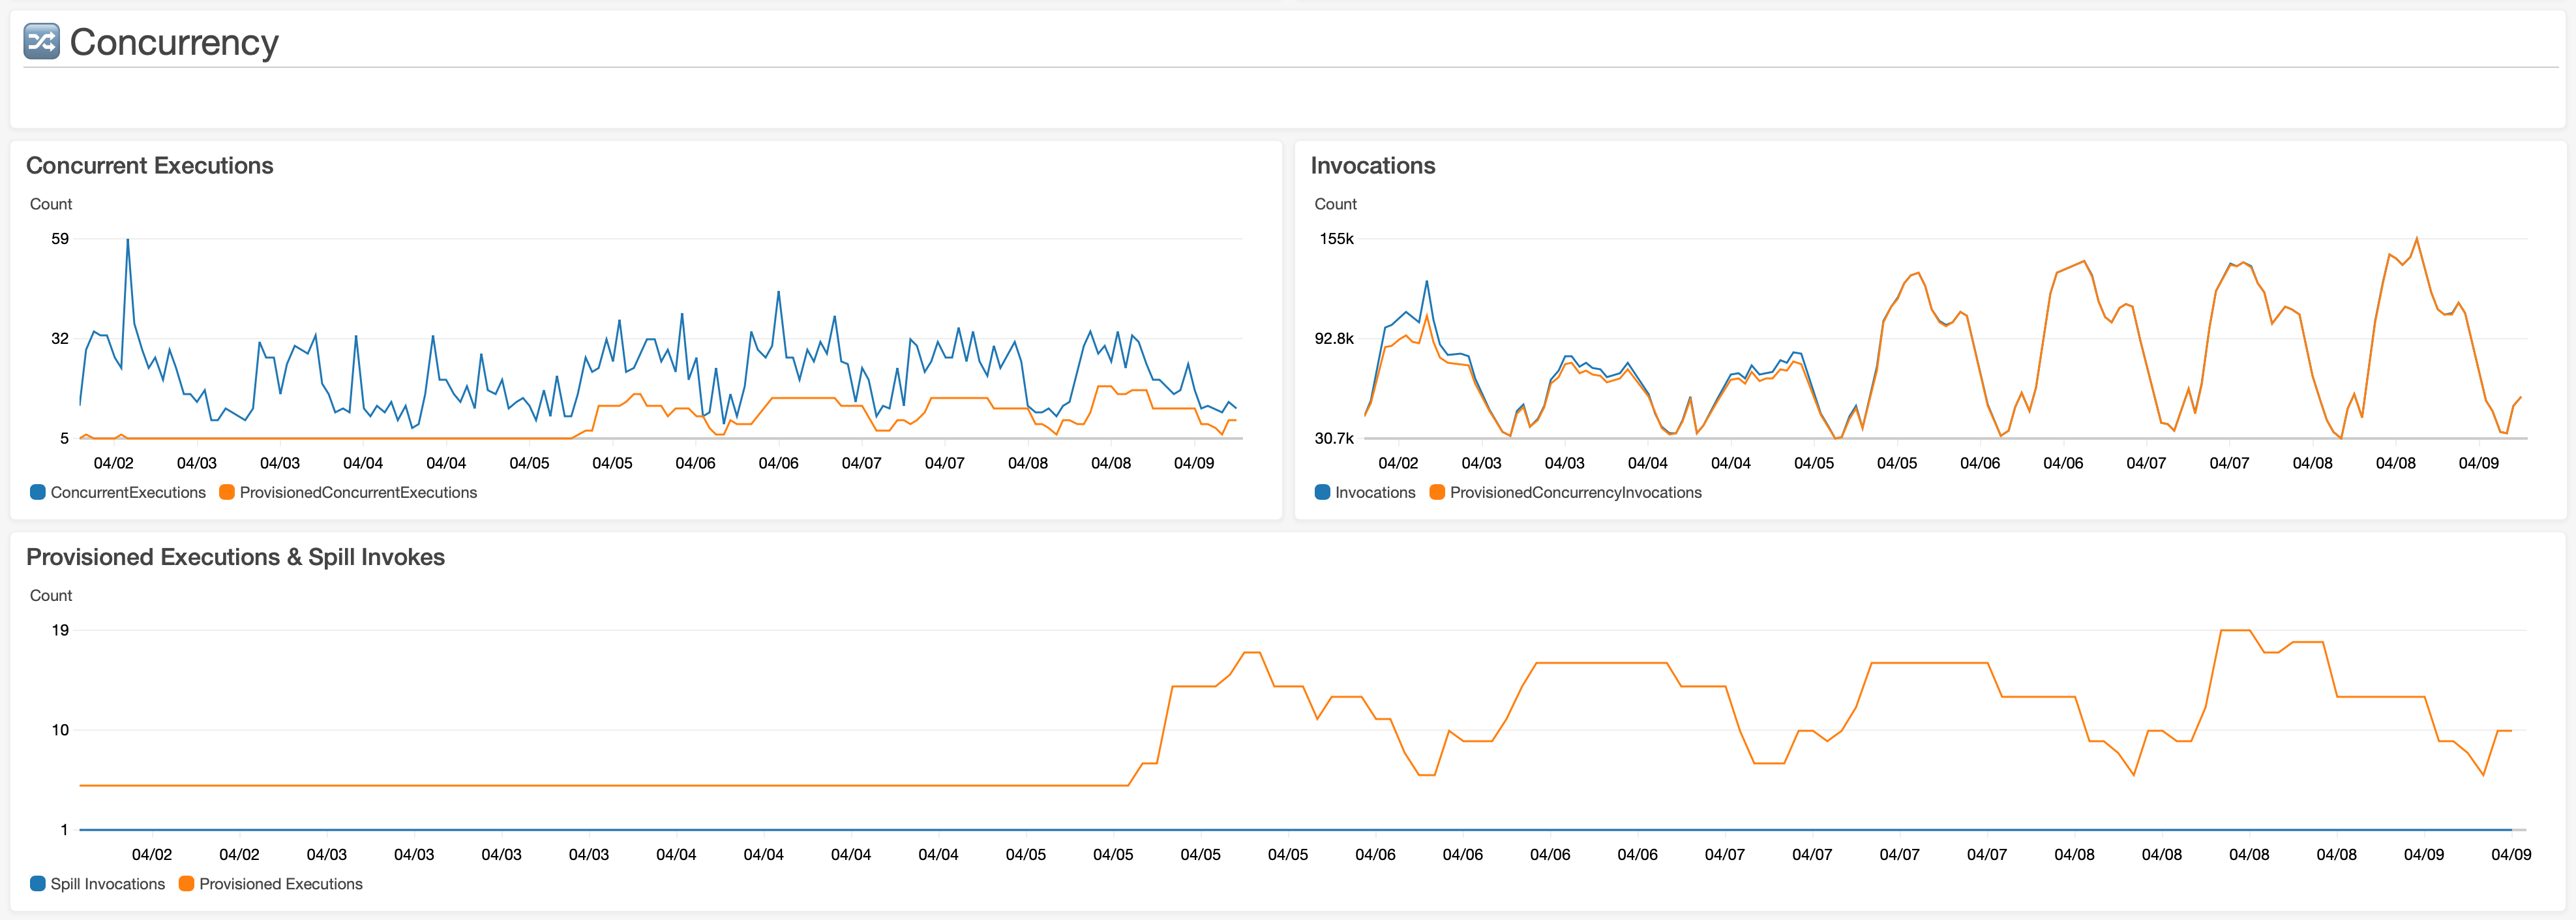
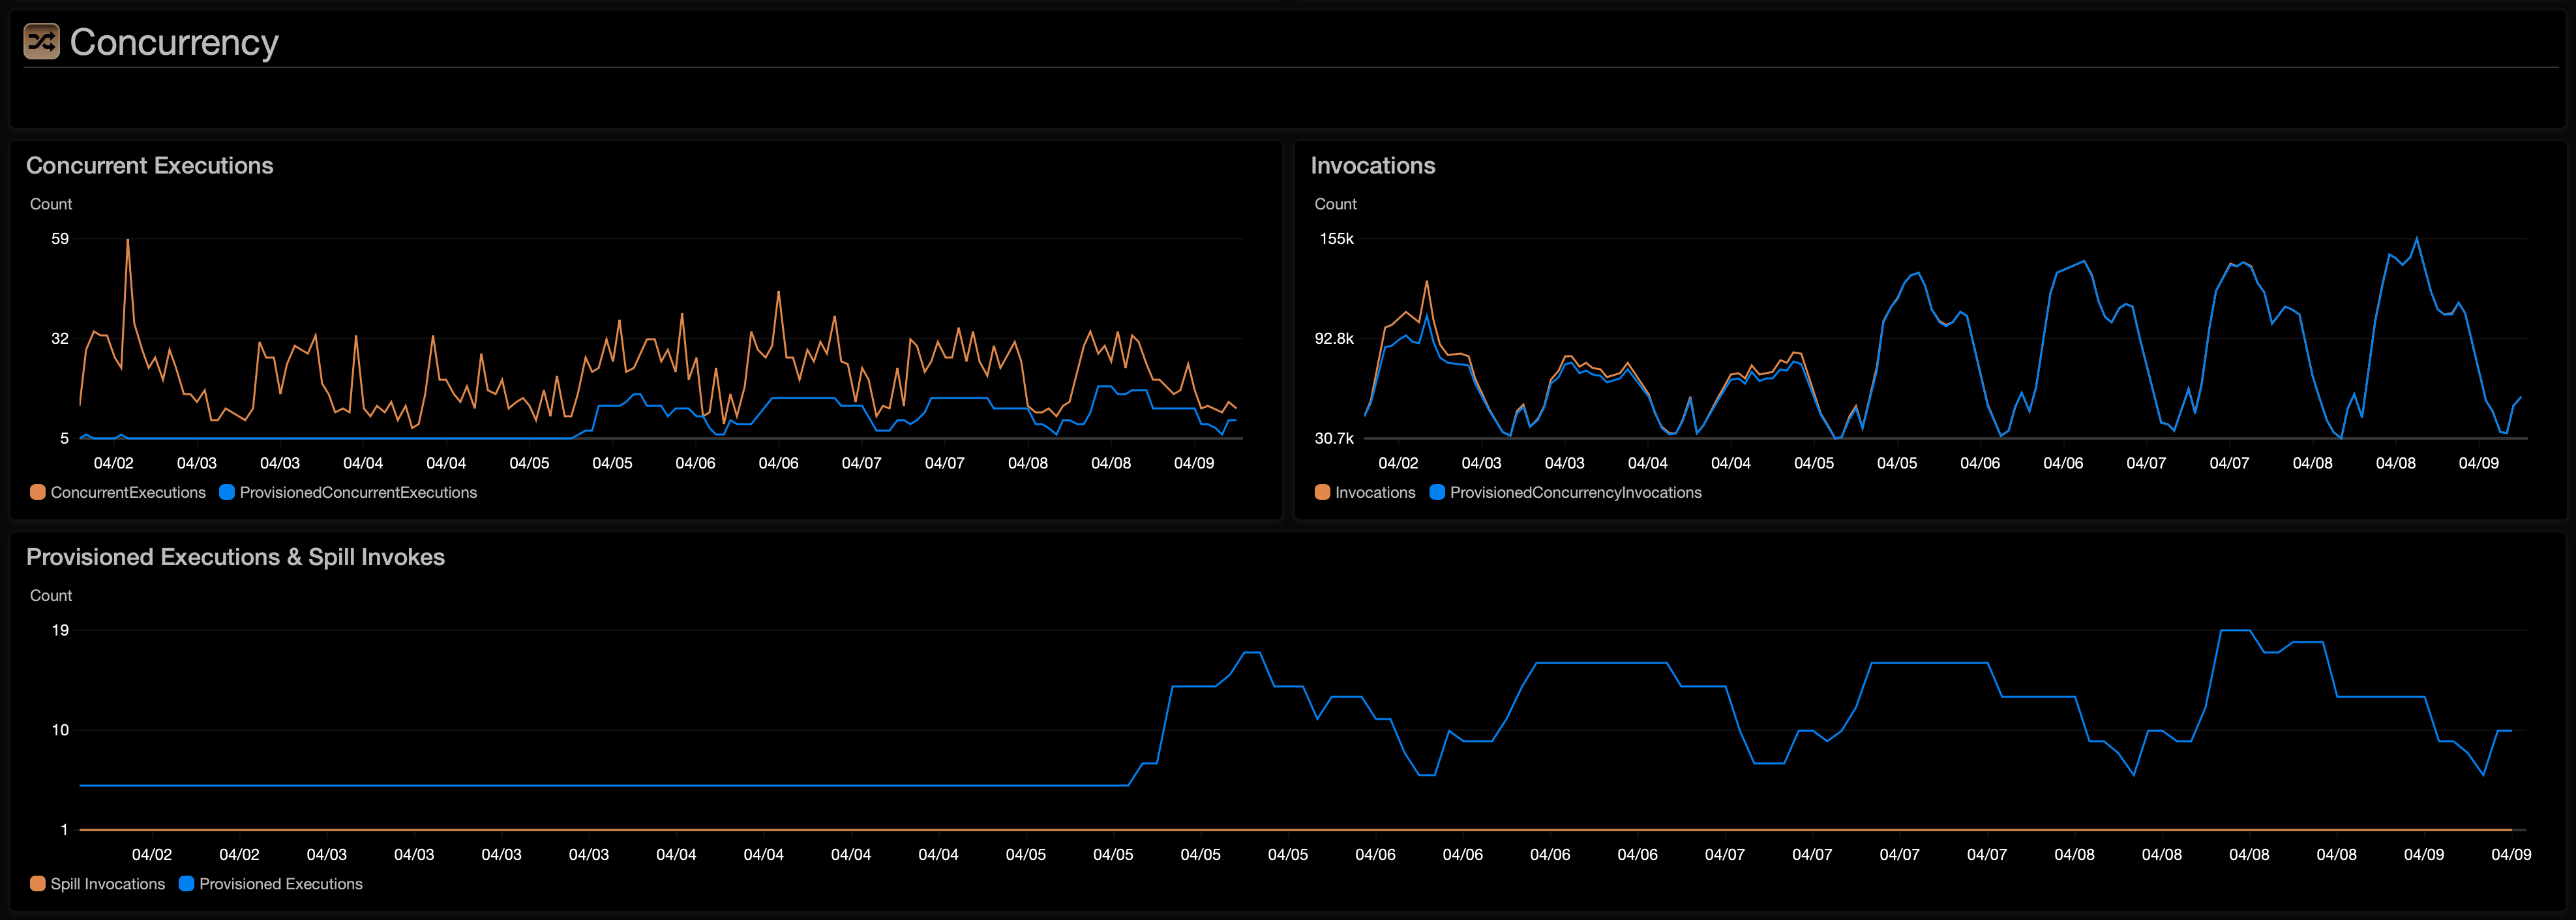
Concurrency CloudWatch Metrics
The graphs below were made using the following managed AWS Lambda CloudWatch Metrics. Please make sure to use your deploy alias of :live when targeting your functions resource in these reports.
ConcurrentExecutionsProvisionedConcurrentExecutionsProvisionedConcurrencySpilloverInvocations
This chart shows that a static ProvisionedConcurrentExecutions of 5 can handle most invocations for the first 3 days. Later, for the remaining 4 days, auto scaling was added with a TargetValue of 0.4. Because of the workload's spiky nature, the Invocations look almost 100% provisioned. However, the concurrent executions show otherwise.
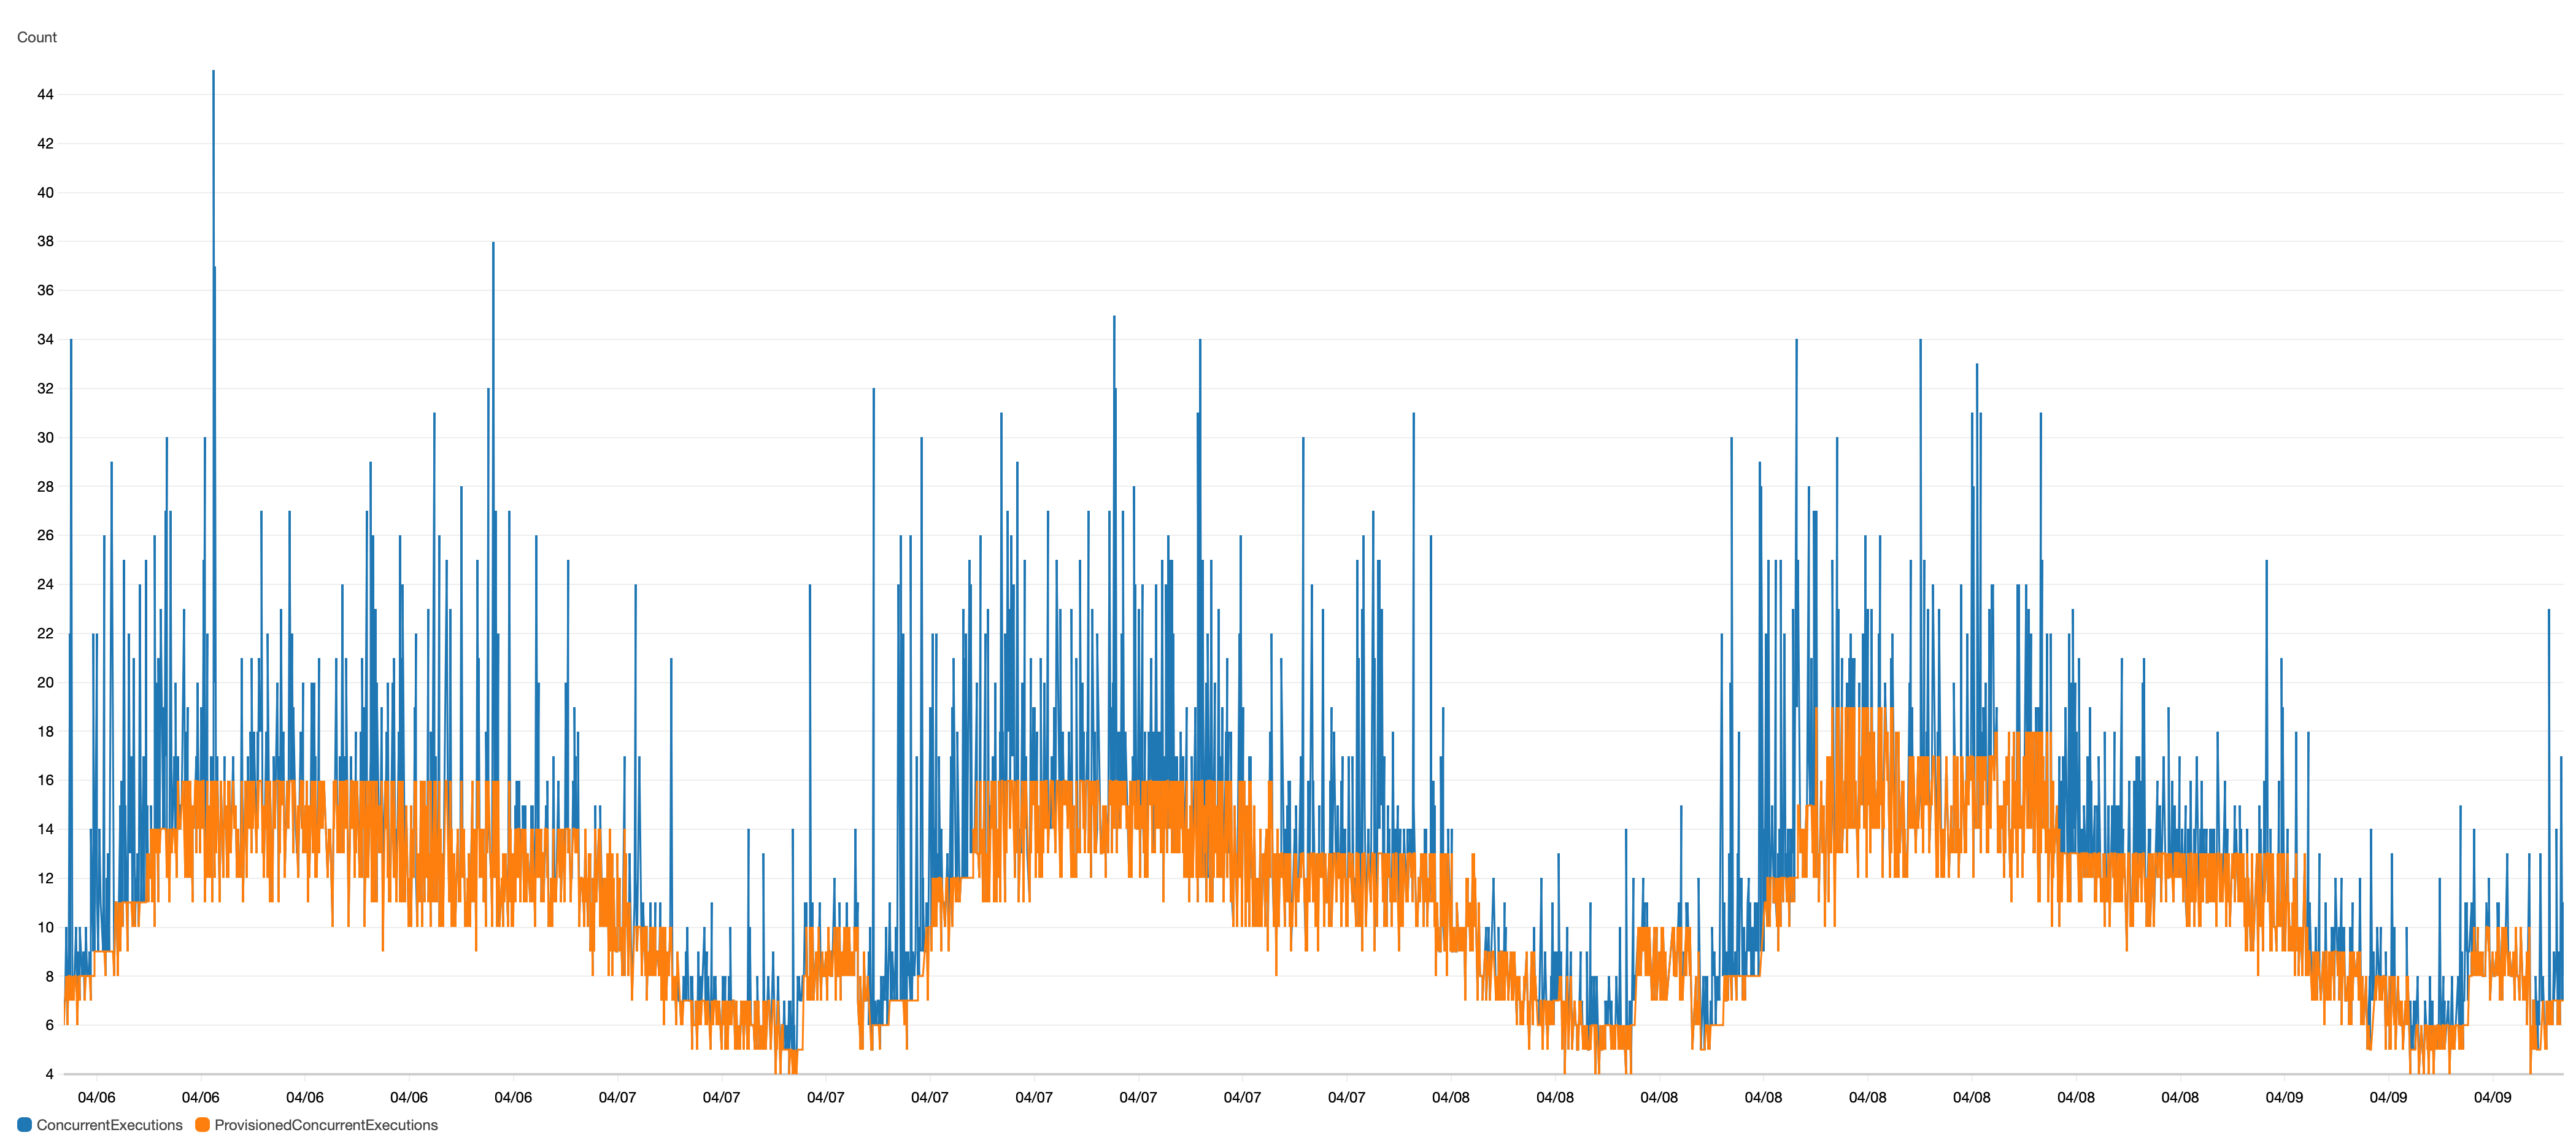
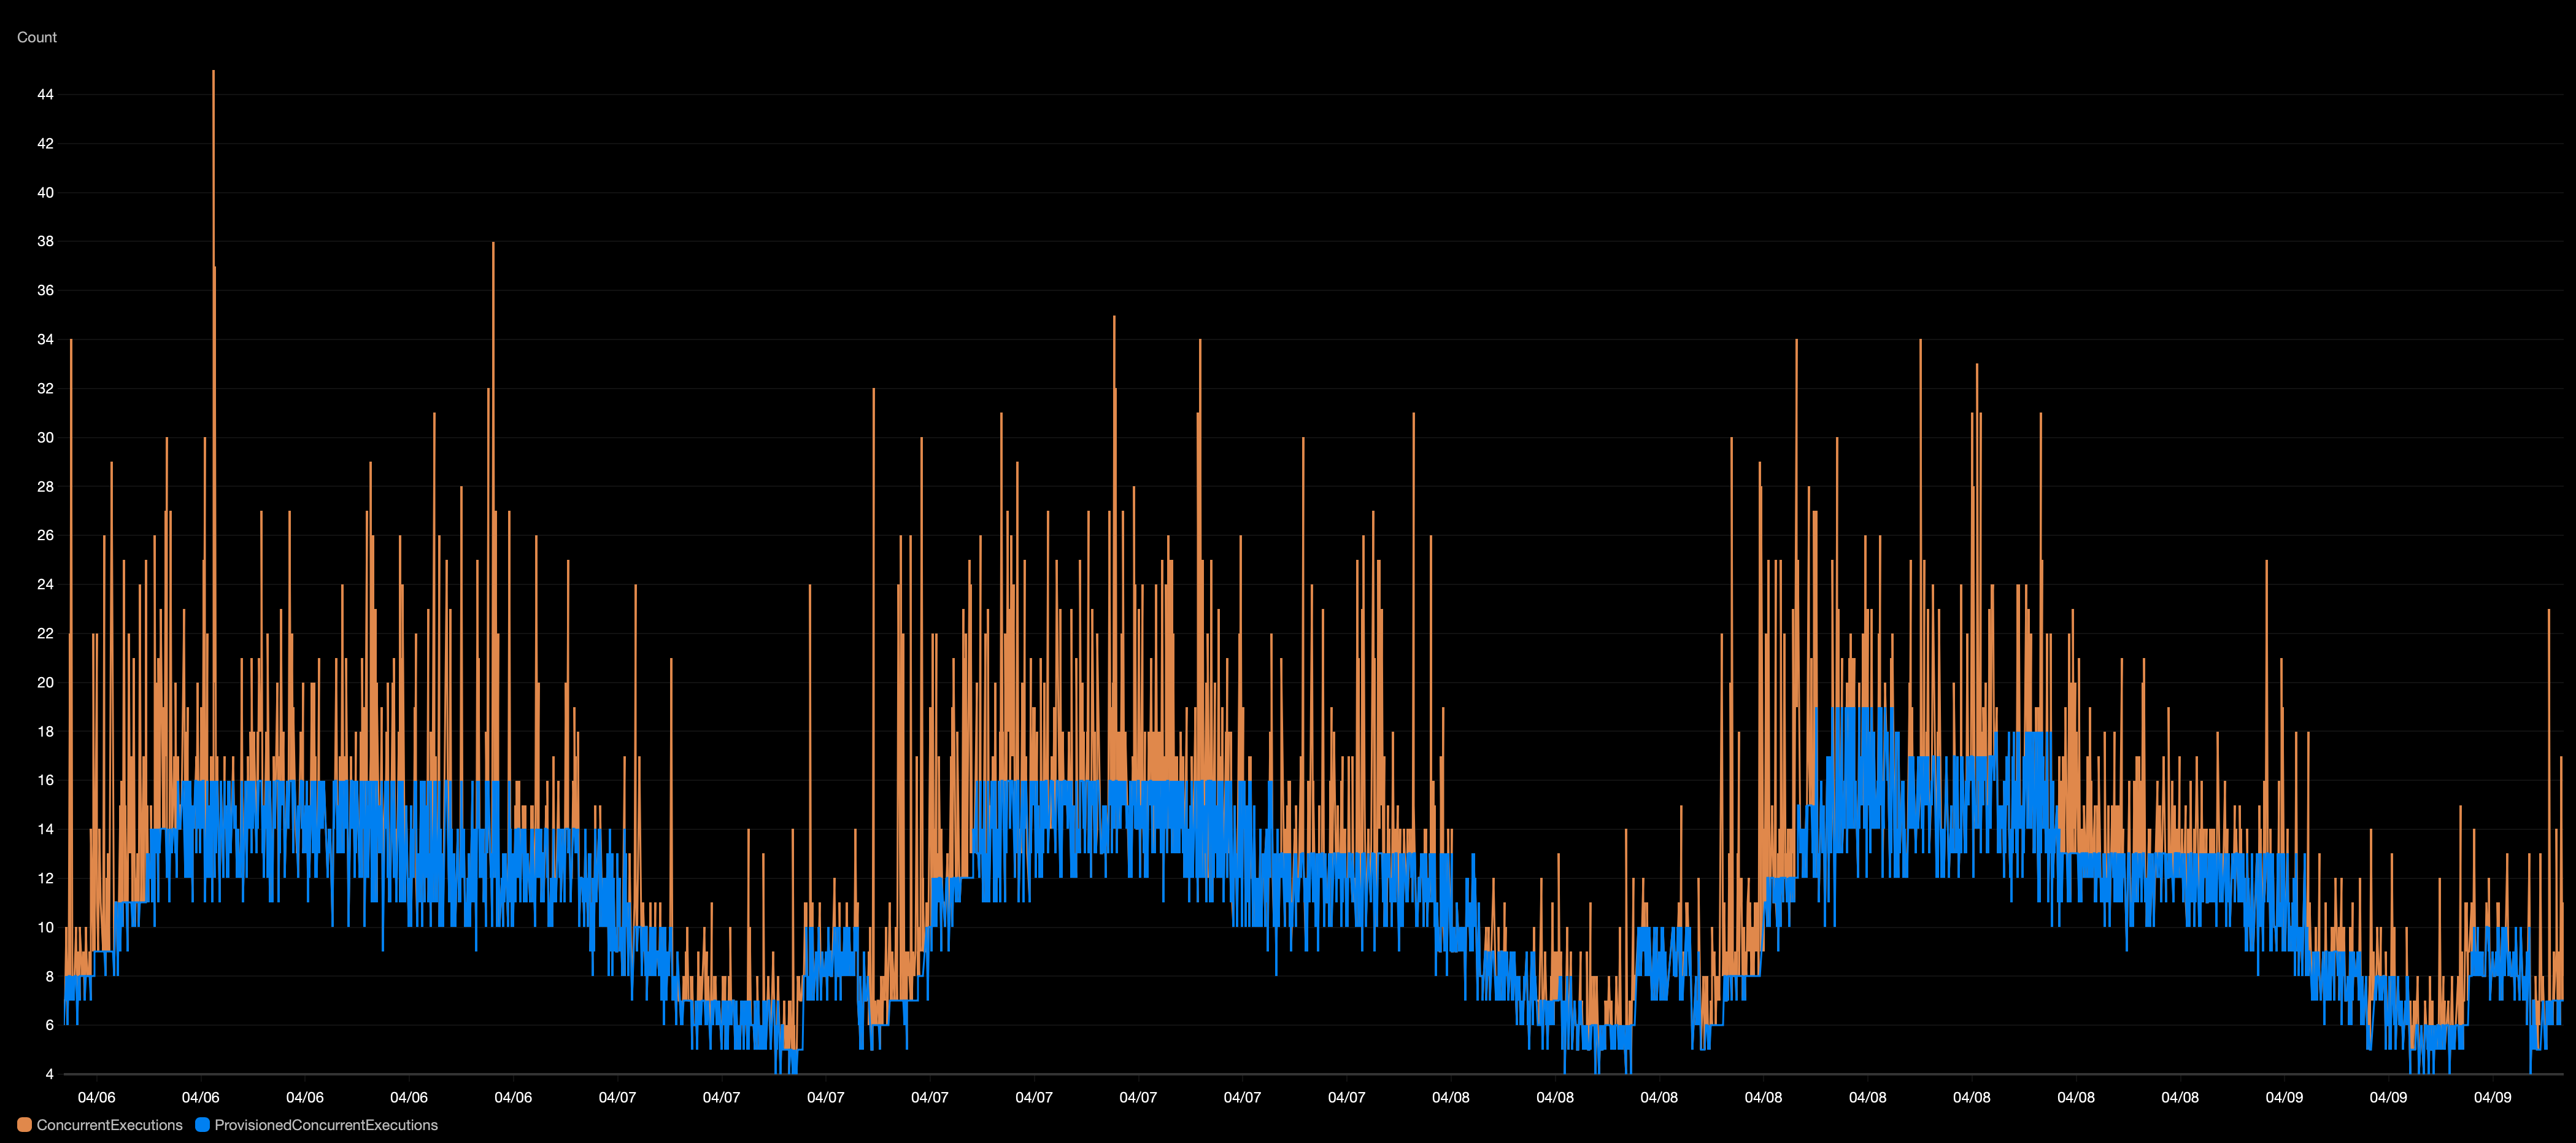
Here is a 7 day view from the 4 day mark above. The TargetValue is still set to 0.4. It illustrates how the default CloudWatch Rule for ProvisionedConcurrencyUtilization metrics over a 3 minute span are not quick enough to scale PC. It is possible to use a TargetValue of 0.1 to force the PC lines to meet the blue. But your cost at this point would be unrealistically high.
Gradual Deployments
As mentioned in the Provisioned Concurrency section we use a simple DeploymentPreference value called AllAtOnce. When a deploy happens, Lambda will need to download your new ECR image before your application is initialized. In certain high traffic scenarios along with a potentially slow loading application, deploys can be a thundering herd effect causing your concurrency to spike and a small percentage of users having longer response times.
Please see AWS' "Deploying serverless applications gradually" guide for full details. However, one way to soften this would be to roll out your new code in 10 minutes total via the Linear10PercentEvery1Minute deployment preference. This will automatically create a AWS CodeDeploy application and deployments for you. So cool!